Published by The CMR Team on behalf of Jason Shapiro
This weeks CMR COT Charts will focus on Stock Market Futures. The charts are based on Futures trader positioning data published by the CFTC called the Commitments of Traders (COT) Report.
From the CFTC website:
The COT reports provide a breakdown of each Tuesday's open interest for markets in which 20 or more traders hold positions equal to or above the reporting levels established by the CFTC. The weekly reports for Futures-Only Commitments of Traders is released every Friday at 3:30 p.m. Eastern time.
The three types of traders in the Futures Only report we cover:
Commercial Traders: Hedgers and owners of the underlying commodity.
Large Speculators: Traders who take on price risk and put on enough position size that it must reported to the CFTC.
Small Speculators: Retail traders who take on price risk but their position size does not meet the threshold to be reported to the CFTC.
This YouTube video helps explain our charts in more detail.
The goal of using this data is to fade both Speculators combined as the reward/risk ratio is favorably skewed based on the idea that they are on the wrong side of the trade once they get crowded. The CMR process is built on the thesis that trader positioning (and not price) is the ultimate discounting mechanism, but trader positioning is not enough to execute the trade; you also need market confirmation.
So when a market reaches max crowdedness (Speculators are crowded long or short) you wait for a news event where price does not react as expected (aka news failure). For example if Speculators were crowded long and bullish news comes out for the specific commodity, and price action is bearish where the market closes red for the day, that is considered a news failure and both requirements are met to make the short trade (fade the Speculators).
Please note this is just a high level explanation to the CMR process. To learn more you can read the New Member Guide posted previously at this LINK.
To learn more and sign up to become a member, you can visit https://www.crowdedmarketreport.com/subscription-plan/ before our membership prices go up on 2/1/2024.
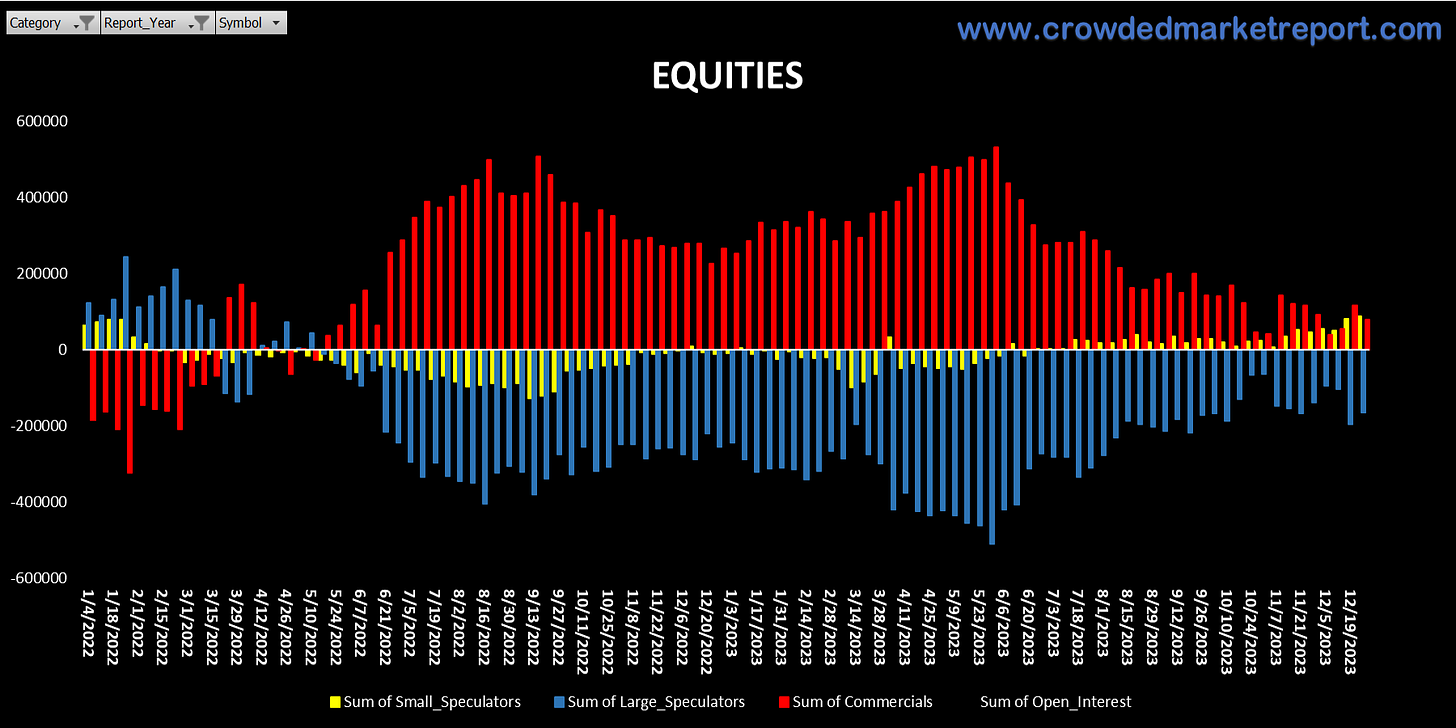
CMR COT CHARTS: EQUITIES
Overall Equity positioning is not crowded when looking at Commercials and Large Speculators, but Small Speculators (yellow column) are the longest they have been since early 2022. This chart combines S&P (largest open interest), Dow, Nasdaq and Russell 2000 Futures.
S&P 500
Positioning is neutral as there was little change in positioning week over week.
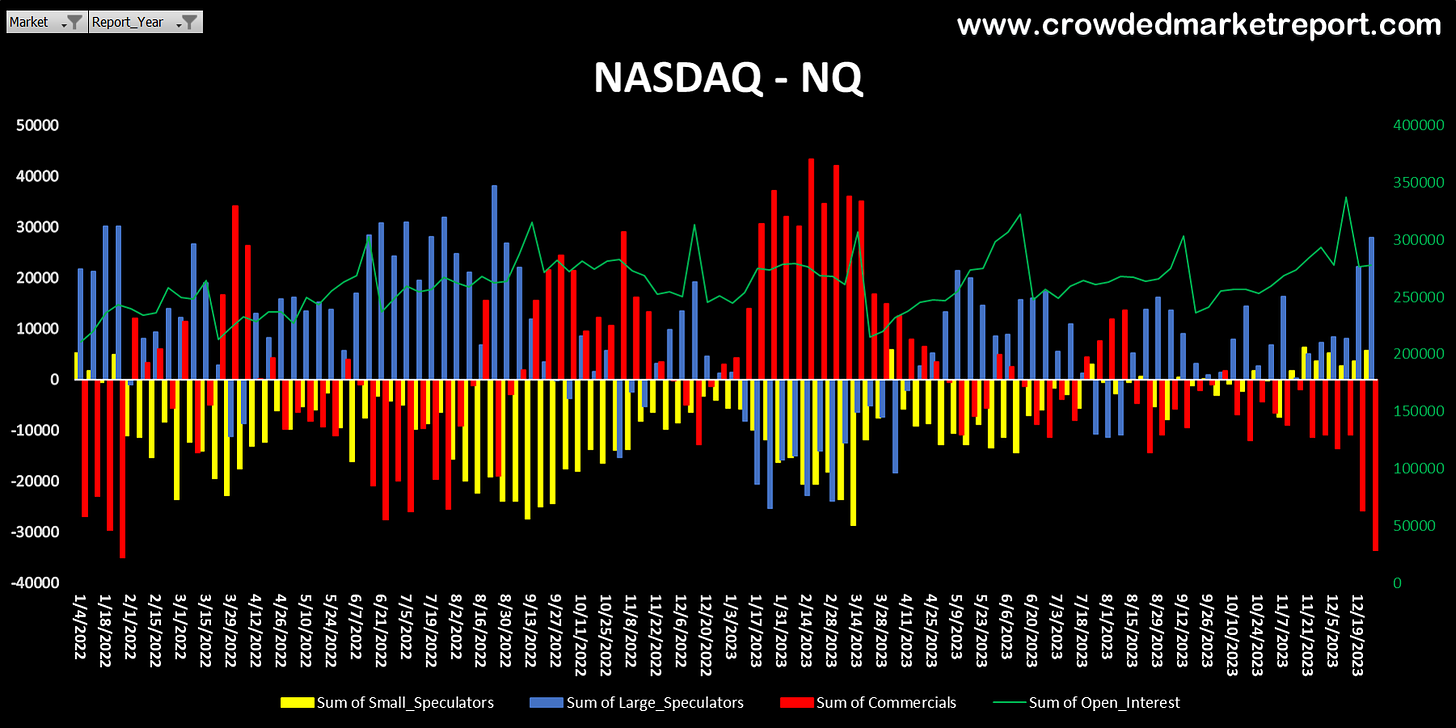
Nasdaq
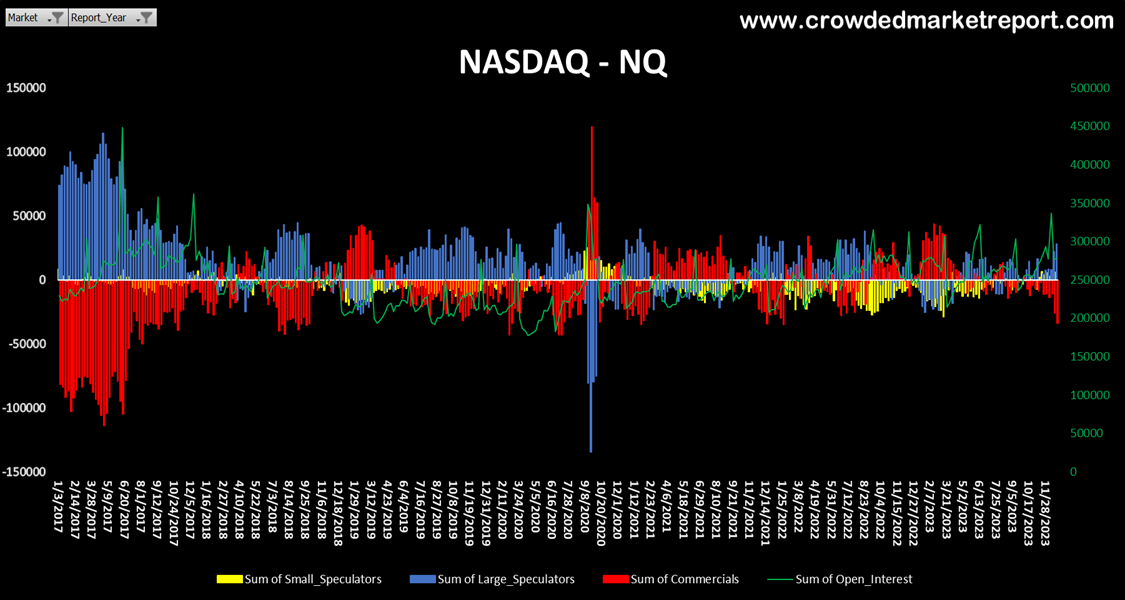
Speculators are crowded long in the Nasdaq, especially Large Speculators. Commercials are at net-short at levels not seen since January 2022. It should be noted that on a longer-term chart, positioning can get more crowded.
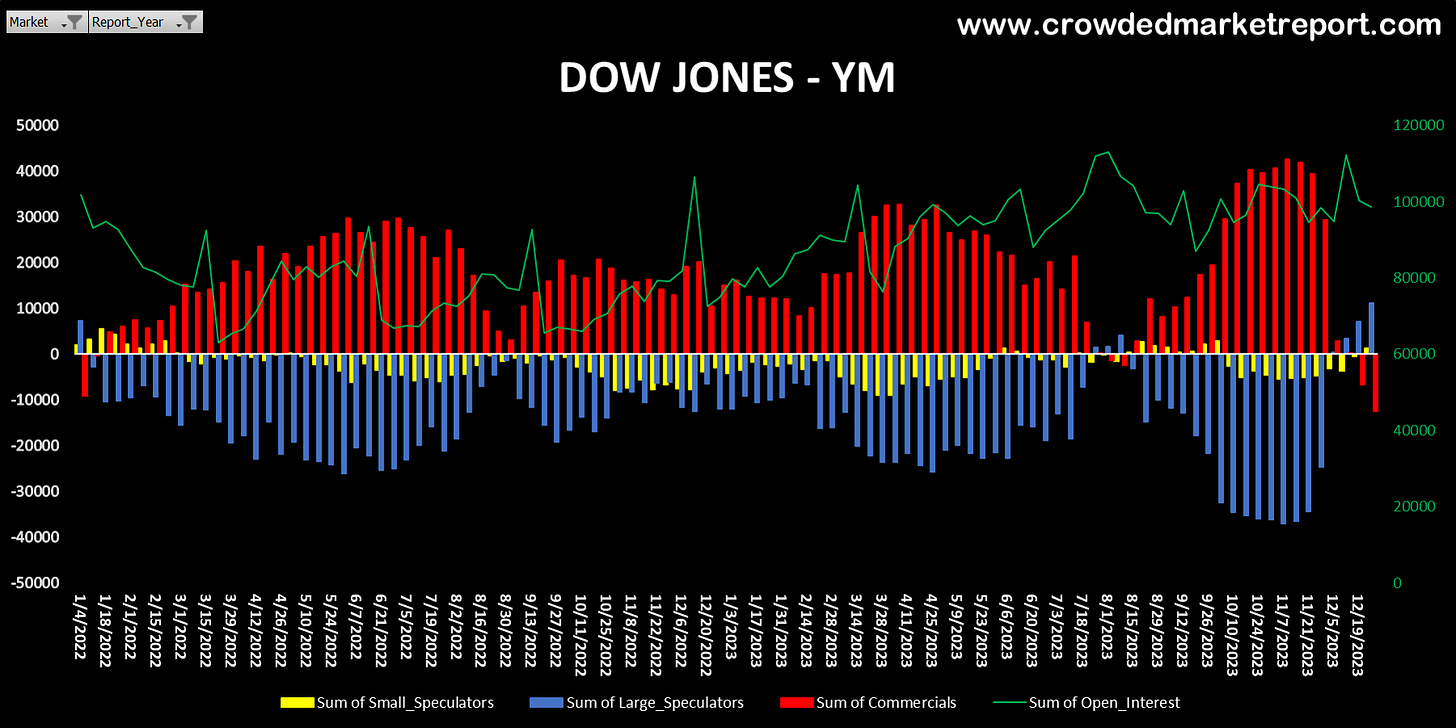
Dow
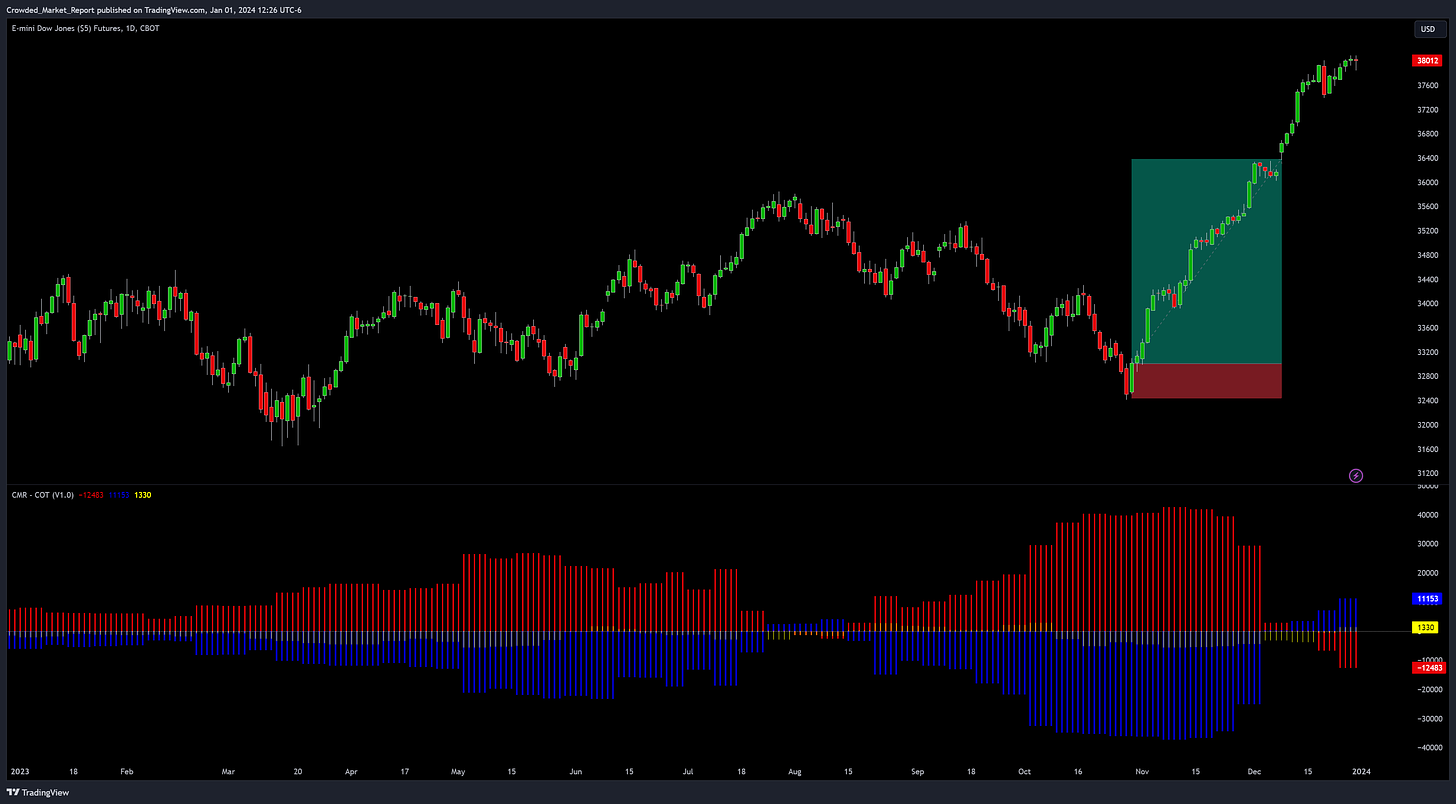
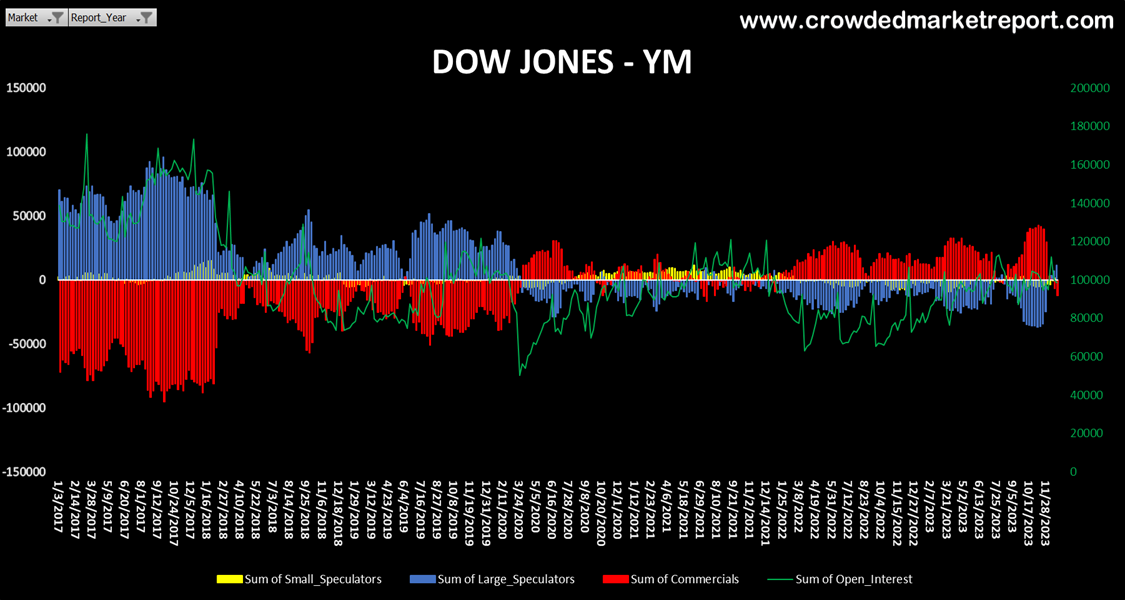
Speculators went from being crowded short in early October to now being the longest they have been in two years. The recent rally in the Dow did cause Speculators to cover their shorts and squeezed price higher in a hurry. Clearly seen in the second chart. In the third chart, which is the longer-term view, Speculators can get more crowded long as historically seen.
Russell 2000
While Small Speculators increased their net-long exposure, Large Speculators continued to cover their short positions. On an absolute level, Large Speculators are still net short, but on an indexed level, they are the least short they have been in two years. Once again, positioning can get more crowded when looking beyond two years.
Thank you for reading this week’s newsletter. Our goal in 2024 is to post CMR COT charts on Mondays and share markets of interest based on positioning. If you are interested in joining our CMR community and becoming a member, just click the button below.
Happy New Year!
Jason Shapiro & The CMR Team
Don’t Trade…Fade
By accessing this post you agree to our Terms of Service


