
CMR Chart of the Week - Silver
How Much Higher Can Silver Go?

The Silver chart is a great lesson that the COT alone is not enough to make a contrarian type trade because trends can last much longer than a trader trying to stay solvent trying to short an uptrend based on the COT showing extreme positioning. Some of my best trades this year have been not shorting Silver, not shorting Gold and not not shorting Copper because I stuck to my process and trading strategy.
Now that Silver is at extreme levels, waiting for a news failure is the next step before considering a short position and taking advantage of a potential skewed reward to risk trade. Quite frankly I hope the news failure does not come because I hate the idea of being short assets here, but I will stick to the process regardless.
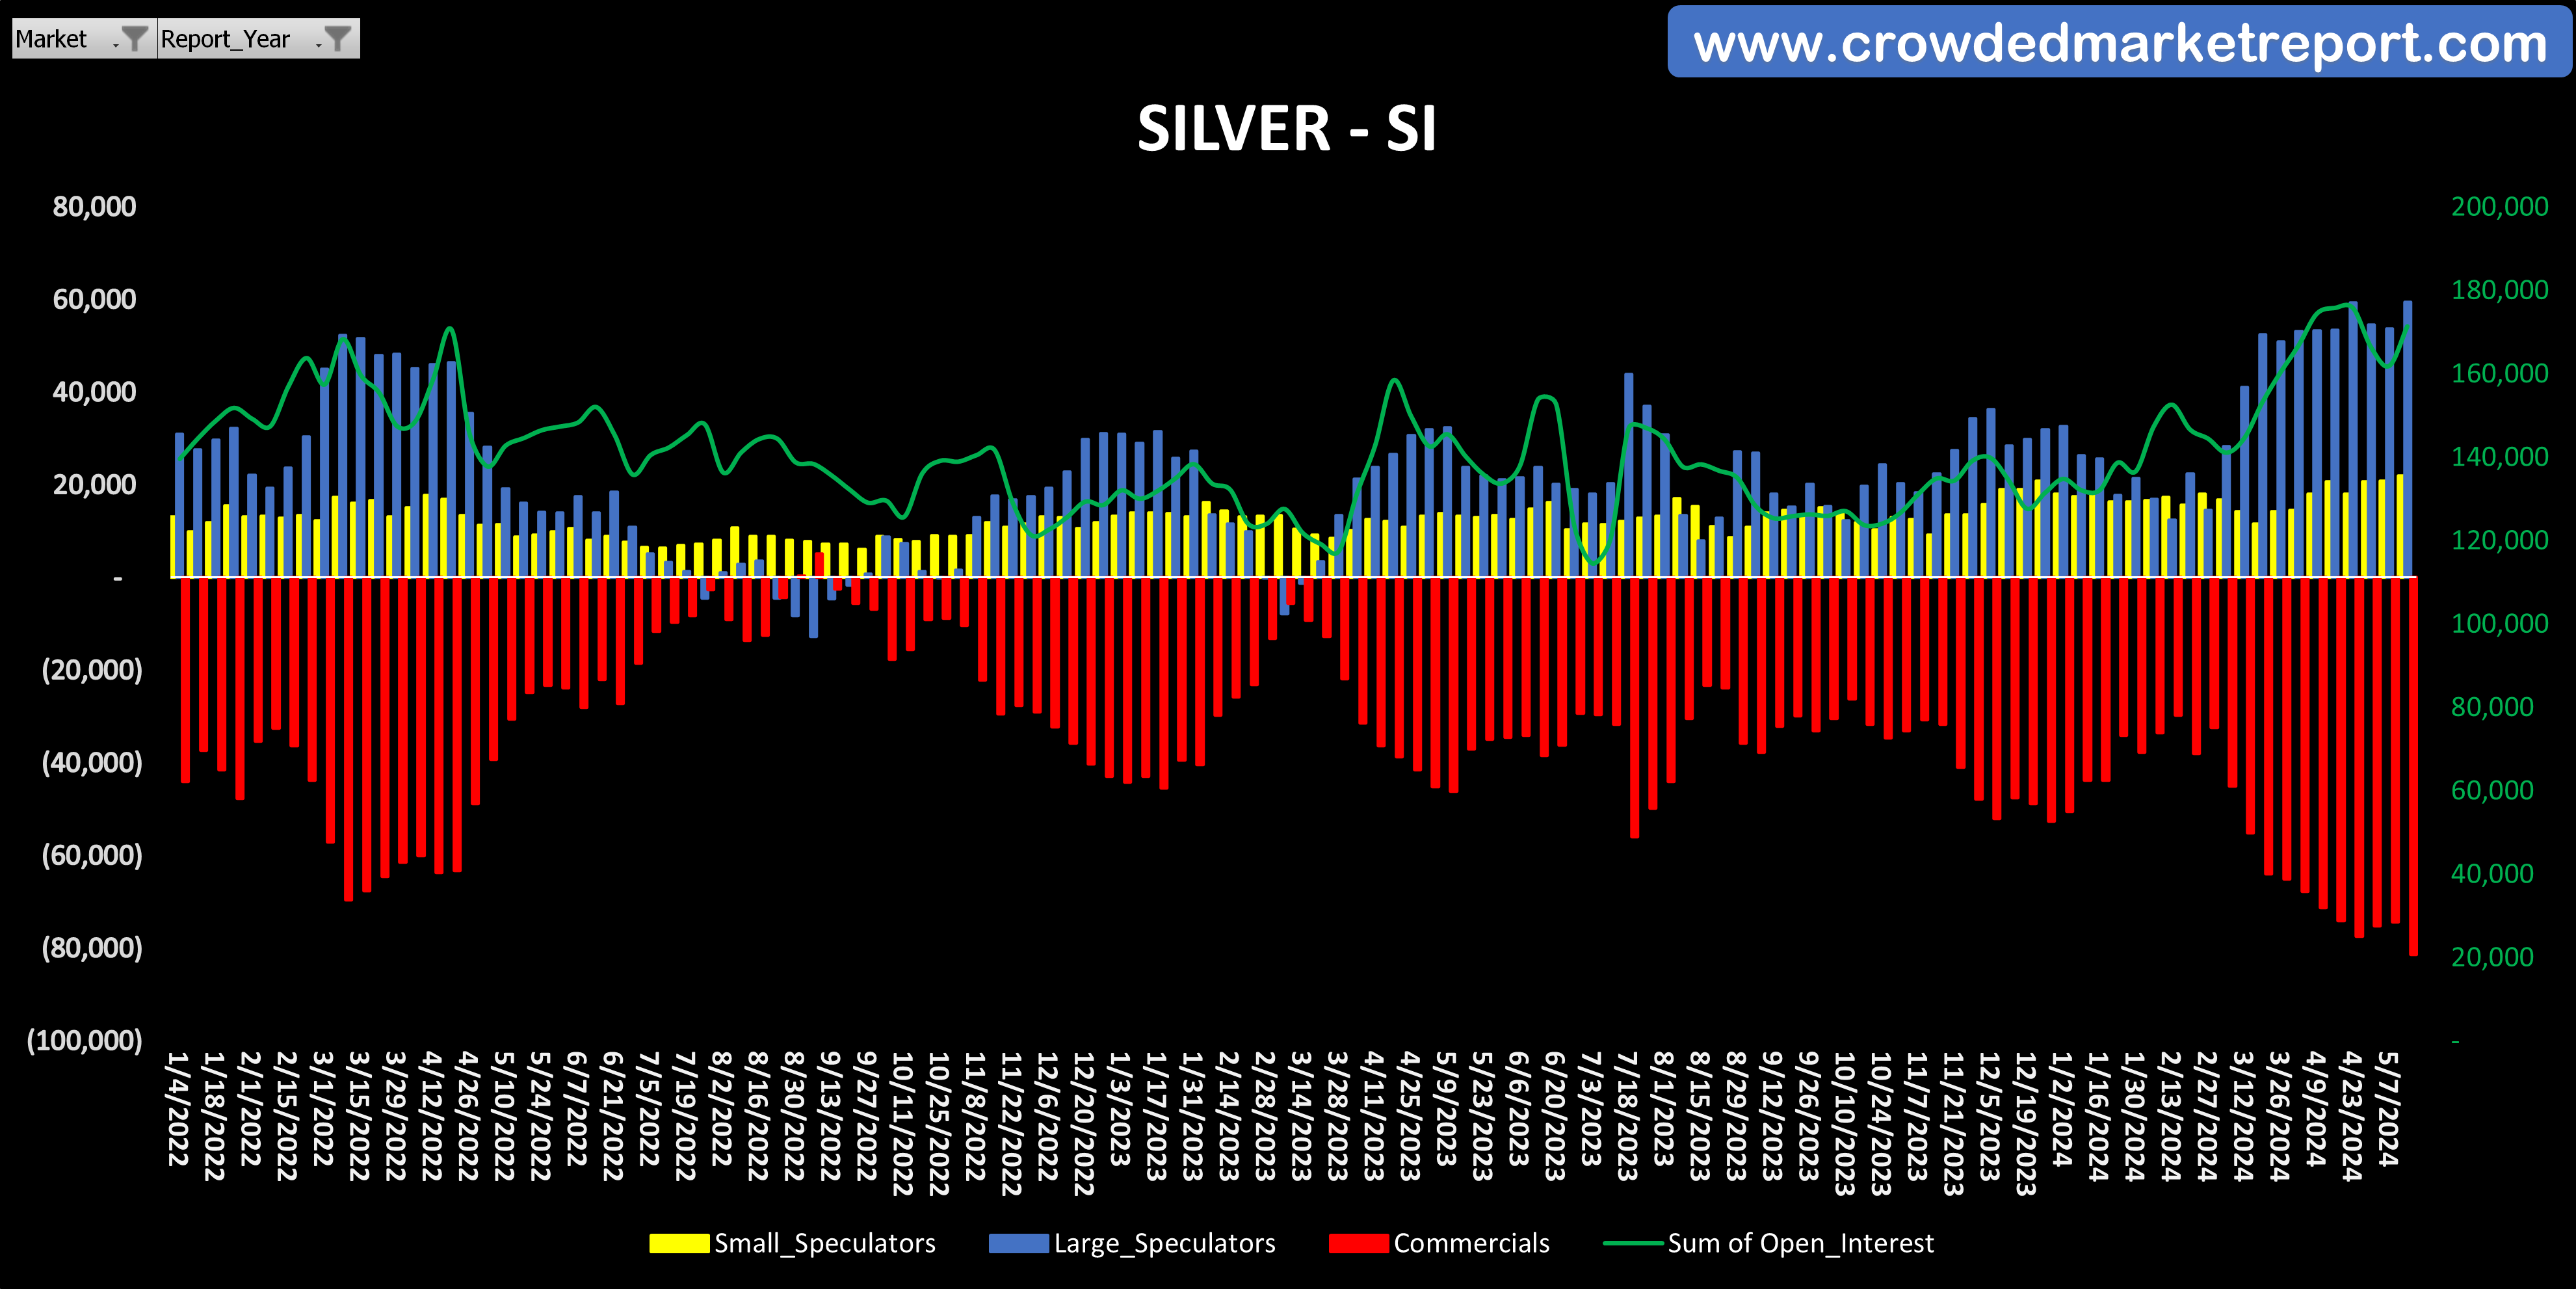
Back to positioning and charts. Here we have three different Silver CMR COT charts. The first is your classic CMR COT view where it is obvious Speculators have joined the trend aggressively and riding the rally higher. Both Speculator types increased their net long positions week over week. Always interesting when they join the trend as it is breaking out.
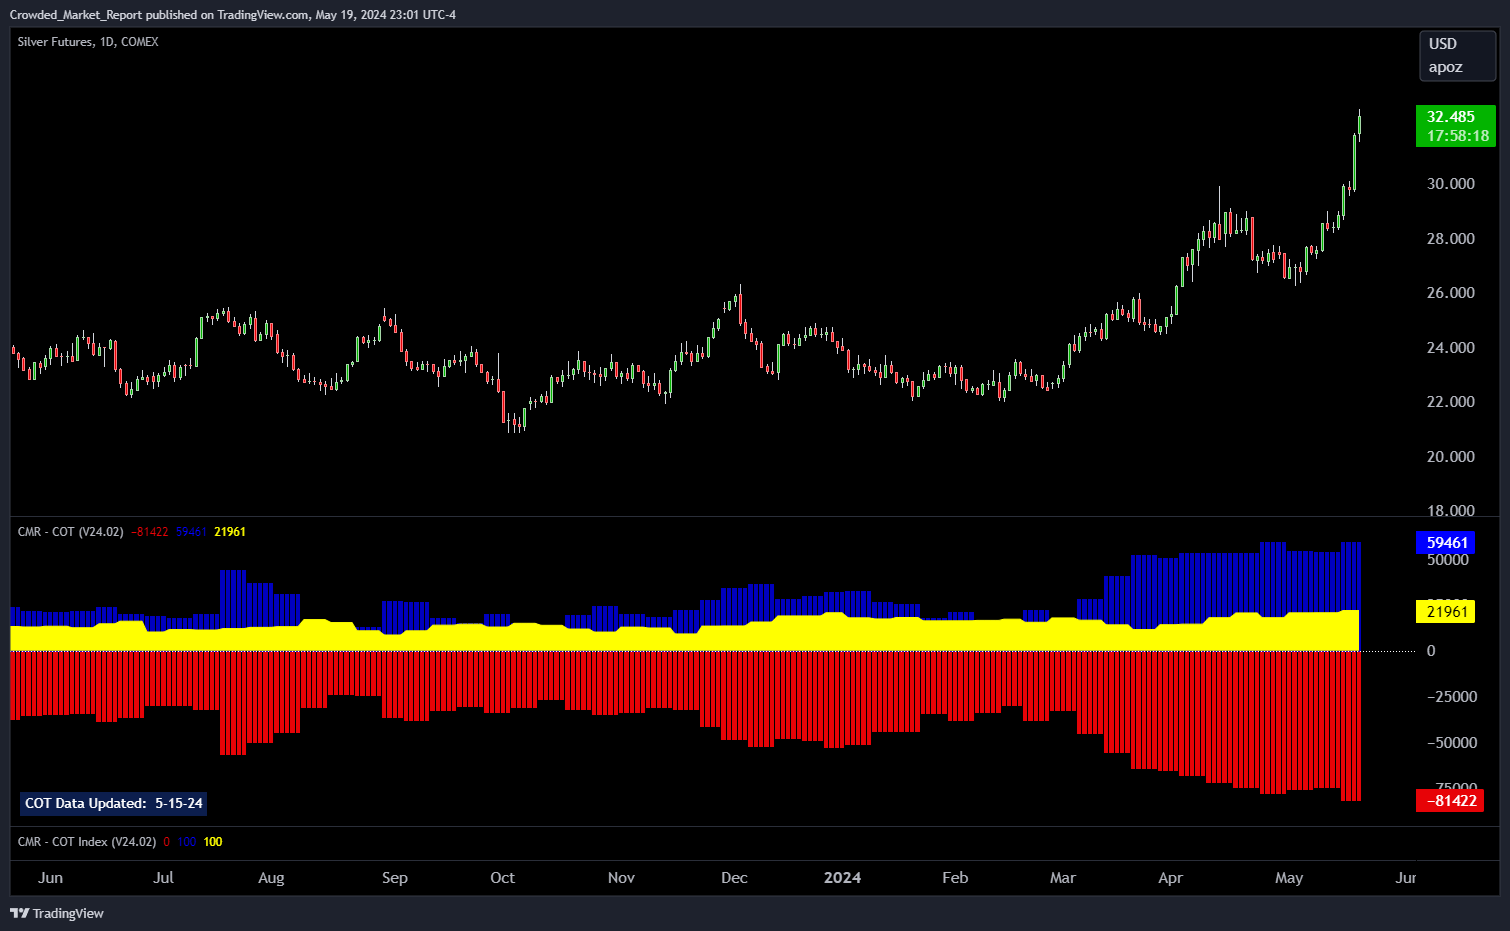
Next chart shows both price and positioning using our TradingView indicators and you can see when Large Speculators started increasing their net-long exposure in early March. There is a misconception that Speculators are wrong and lose money all the time. This shows that they timed the rally pretty well. The exact idea is there is a higher probability of Speculators being wrong when they are extremely crowded and are all on the same side of the trade, especially when both Small and Large Speculators are at max indexed levels. Also, just because they entered the trade correctly, the key is to exit the trade and keep your profits over time.
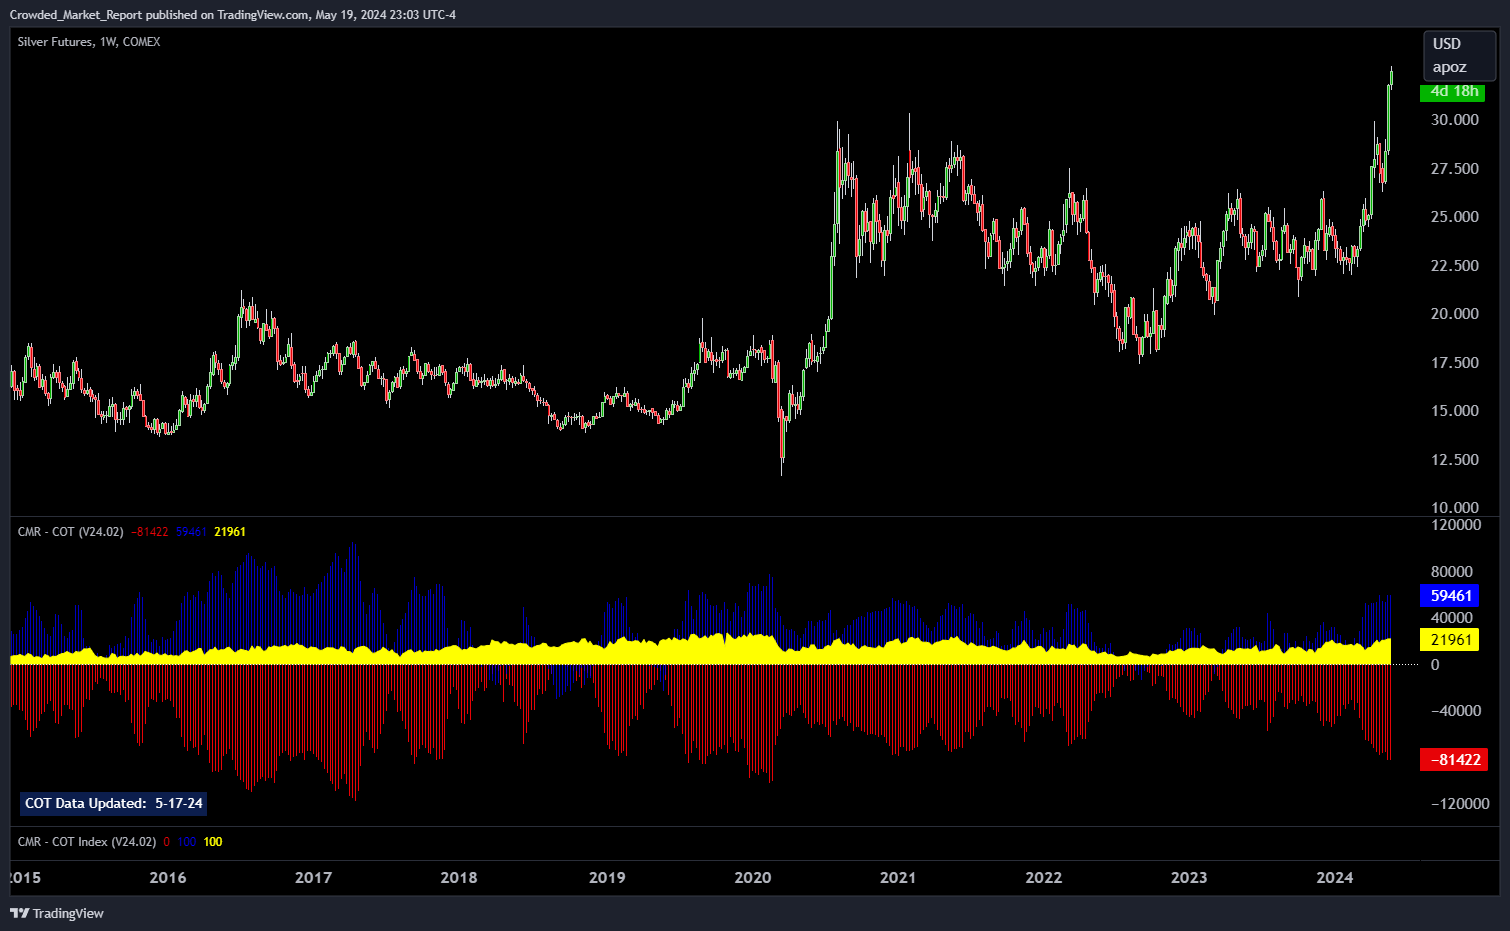
Last chart shows that positioning can get more extreme. A longer-term weekly five-year chart of Silver shows how extreme positioning can become. Another reason why we do not recommend front running the trade based on COT alone. A good way to learn about COT and positioning is for the reader to observe how price behaves when positioning gets to extreme levels, especially after the market turns and Speculators cover their positions. A few examples in the chart below.
Hope you enjoyed today’s post. If you are interested in learning more about the Crowded Market Report and the services we provide, which includes more in depth analysis of all major markets including Precious Metals (Gold, Silver, Palladium, Platinum), Industrial Metals (Copper…), Equities, Crypto, Currencies, Energies and more, please visit www.crowdedmarketreport.com.
Thanks,
Jason Shapiro & The CMR Team

CMR Publishing LLC is a content provider and publisher and is not a registered broker-dealer. By accessing Crowded Market Report websites and/or using Crowded Market Report products and services, including without limitation Substack and any and all content available on or through the Service and via email, you understand and agree that the material provided in CMR Publishing LLC dba Crowded Market Report products and services is for informational and educational purposes only, and that no mention of a particular security in any Crowded Market Report product or service constitutes a recommendation to buy, sell, or hold that or any other security, or that any particular security, portfolio of securities, transaction or investment strategy is suitable for any specific person. This content is for educational purposes only.
I think one more green solid weekly candle and good news and we are going to lock in the top of this bull market. My favorite contrarian setup is playing out for a trend reversal on SP,NQ and gold all at ones on the weekly chart. 🙃